
For NZ Arable Growers · Rotation-led, margin-first

The five Fs are eating the gross margin. Get every hectare working harder.

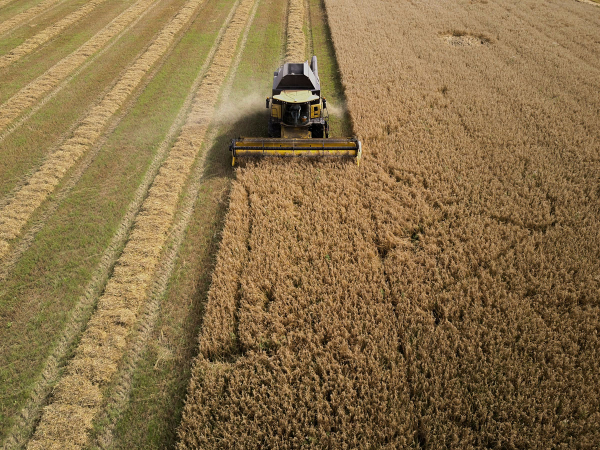
Fuel, fertiliser, freight, chemistry, finance — a cereal crop that cost $2,200–$2,500/ha to grow five years ago now runs $3,200–$3,800/ha, and feed grain still sits under a price ceiling set by imports. GroundShift is an independent advisory team and AI platform built around the strength of NZ's rotation-based system. One whole-farm view across soils, rotation, crops, and financials. One credible plan. Cashflow protected at every step.

Independent · Whole-farm · Rotation-led
Arable Farm • 310ha effective • Cereals & ryegrass seed

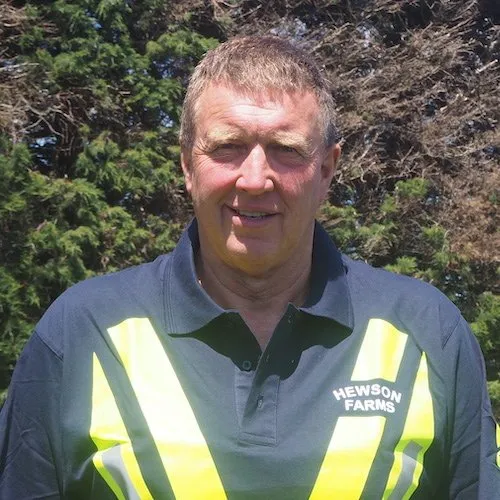
Whole-farm soil baseline showed we were blanket-applying N across the whole rotation — same rate on paddocks coming out of a clover phase as ones following barley. We pulled it back using FAR's nitrogen calculator: one season, $26k off the fert bill, feed wheat yield up 0.4t/ha. The bank got a cost-of-production number per tonne it could actually work with.

Hamish Pinckney
Arable Farm • Canterbury
  • FAR-aligned. Future Fields 2030 ready Soils
  • Rotation + Crops + Financials — one whole-farm view
  • We don't sell fert, seed, chemistry, or schemes
  • Bank-credible before/after on yield & cost of production
  • Independent. Human-first. NZ-built

How it works

Advisory + tech, at every step.

Assess

Farm walk with you and the team. We look at covers, soils, herd condition, the dairy shed, and the books. We pull in your MINDA records, Insights Report, and last season's accounts to set a real baseline.

Plan

One whole-farm plan that protects cost of production. Pasture rotation, feed budget, fert plan, mating decisions, debt position — sequenced for the season ahead with clear decision gates.

Execute

Two-paddock trials, not whole-farm gambles. The platform tracks covers, leaf emergence, supplement use, and kgMS — flagging when something's off rotation before the wedge tells you the hard way.

Prove

Before/after on cost of production, kgMS, and emissions intensity. One report your bank manager actually reads, your processor accepts for the Co-operative Difference, and your team can stand behind.

The Reality

It's getting tougher out there.
$
42
bn

Five Fs cost rise since 2020

Fuel, fertiliser, feed, freight, finance. Margin pressure shows up in supplementary feed first — the largest line on most NZ dairy P&Ls.

1
in 4

NZ farms under debt pressure

Servicing costs climbing while the bank wants a credible plan and proof of cost-of-production discipline.

414
kgMS

Average milksolids per cow

A new high — but built off a 0.5% national herd reduction. Productivity per cow is doing the heavy lifting. Pasture is where it's earned.

Are you harvesting the most from every hectare?

Whole-farm coverage

Every part of the arable system

Rotation & Yield

Make the rotation work harder.

A well-built rotation is still the cheapest agronomy on the farm — pasture and legume phases build nitrogen, break disease cycles, and lift the cereal crops that follow. Sequenced and planned forward, not crop-by-crop in isolation.

  • Whole-rotation plan across cereals, seed, and pastoral phases
  • Gross-margin-ranked crop choice that flexes with contracts
  • Break-crop & legume strategy to cut N and disease load

Soils & Nutrients

Stop over-applying nitrogen.

Most arable farms still apply N on a blanket rate, not a soil test. Whole-farm baseline shows you where the value is — and where the waste is. The single biggest input lever on most farms, and the one the regulator is watching.

  • Whole-farm soil baseline + paddock-level N strategy
  • FAR soil nitrogen supply calculator built in, not blanket rates
  • OverseerFM, FEP & freshwater N-cap compliance built in

Crop Performance

Yield per hectare, per dollar.

Variety choice, sowing date, disease pressure, irrigation, grain quality and contract spec — managed as one system. Crop performance read alongside input cost and the price ceiling, not in isolation.

  • Variety & sowing-date plan matched to your contracts
  • Disease & chemistry program sequenced to protect margin
  • Yield mapping & agronomy data, all in one view

Cost of Production

The numbers your bank wants to see.

Cost of production per tonne, gross margin per hectare, breakeven yield, sensitivity to grain-price swings. Bank-credible reporting that sets up the seasonal review, the next loan, the succession conversation.

  • Cost-of-production benchmarking by crop and region
  • FAR / Future Fields 2030-aligned reporting
  • Bank-ready before/after, plus 3–5 year roadmap

Word of mouth

From the paddock, not the boardroom.
Whole-farm soil baseline showed we were blanket-applying N across the whole rotation — same rate on paddocks coming out of a clover phase as ones following barley. We pulled it back using FAR's nitrogen calculator: one season, $26k off the fert bill, feed wheat yield up 0.4t/ha. The bank got a cost-of-production number per tonne it could actually work with.

Arable Farm • Canterbury
310ha effective • Cereals & ryegrass seed • United Wheatgrowers
$26k
Saved on N yr 1
0.4
t/ha yield lift

What sets us apart

Groundshift vs the usual approach

Typical Providers

  • Fert / seed / chemistry reps, scheme partners
  • One product line at a time
  • Whole-farm switch on faith
  • Replaced or talking past each other
  • You stitch it together each season
  • Anecdotes and last year's accounts

Groundshift

  • Independent, no products to sell
  • Rotation · Soils · Crops · Financials
  • Two-paddock trials with decision gates
  • Agronomist, contractor, consultant — coordinated
  • FAR & freshwater-compliance ready
  • Cost-of-production proof, defensible plan
Straight Answers

Things growers actually ask.

If your question isn't here, ring us. Real person, real number: 0800 GROUND (476 863).

No. We're outcome-led, not ideology-led. NZ's pasture-based system is already one of the most efficient in the world — we're not trying to change the model, we're trying to get more out of it. If a regen practice makes sense on your farm, great. If conventional N timing works better, that's what we'll recommend. The only test is what holds margin.

Now is usually fine. We sequence the work around your season — assessment in the shoulder months, trial paddocks chosen so they don't disrupt mating or peak production. Most farmers start with a farm walk, get the baseline back in 3–4 weeks, and have decisions to act on before the next planning window.

We use OverseerFM where it's required and supplement it with paddock-level soil data. The plan is built to your regional council's freshwater rules and the upcoming RMA changes — not against them. You get one set of numbers that works for your council, your processor, and your bank.

Ready when you are

Start with a paddock walk and a cup of tea.

One visit. Whole decision team. We walk the paddocks with you between operations, sit down with the books, and within a few weeks deliver a whole-farm baseline — rotation, soils, yield, cost of production. No commitment beyond the first conversation.

  • Independent advice
    We don't sell fert, seed, chemistry, or schemes — full stop.
  • Whole-farm view
    Rotation, soils, crops, and financials — one connected plan.
  • Bank-credible
    Cost-of-production proof and a defensible 3-year roadmap.
Contact Details
Contact Details
Contact Details

By submitting this form you agree to us contacting you and using your details for marketing purposes as per our privacy policy.

Thank you! Your submission has been received!
Oops! Something went wrong while submitting the form.